
News
When Major Events Push City Traffic to the Breaking Point

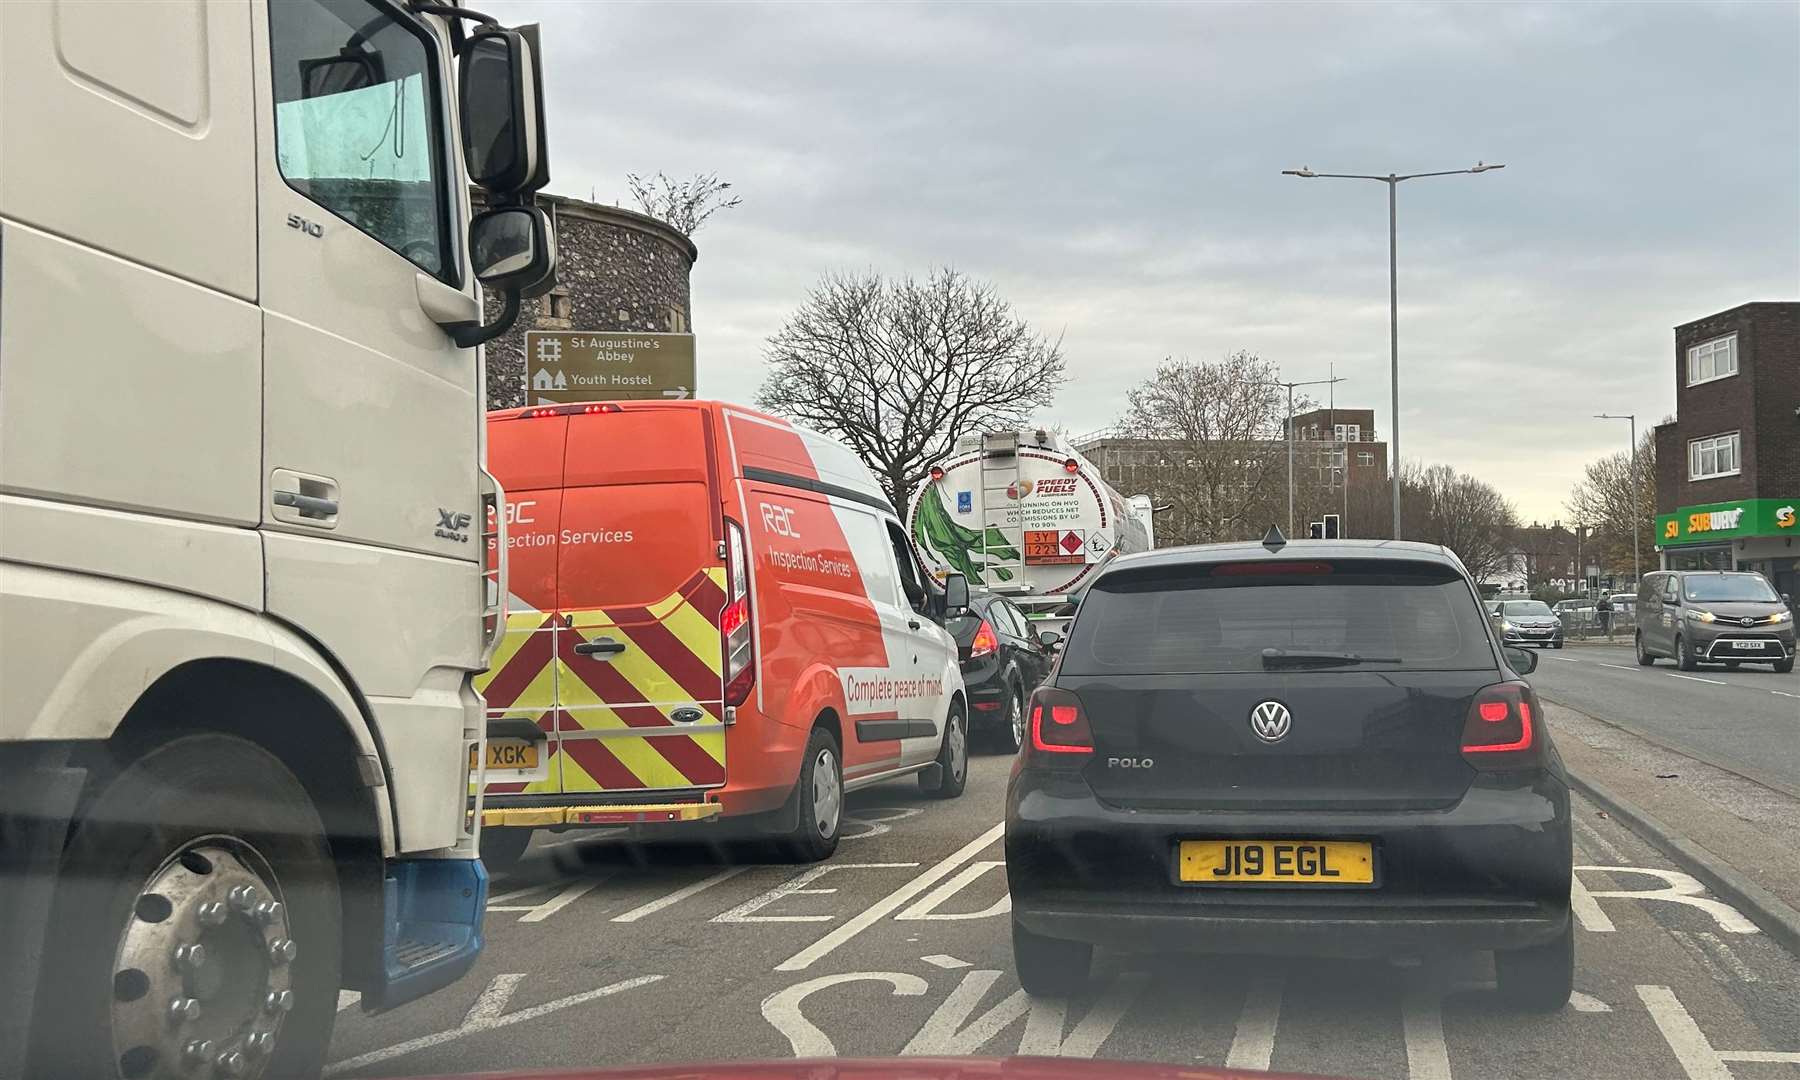
A packed stadium can hold 60,000, 70,000 or even 80,000 people. Moving that many people through a metropolitan road network within several hours can turn ordinary congestion into a transportation bottleneck affecting commuters, businesses, emergency services and residents who have no connection to the event itself.
Research by Attorney Brian White examined how major North American cities perform when transportation systems are subjected to this kind of extraordinary demand.
Originally developed around the cities hosting the 2026 FIFA World Cup, the analysis offers a broader measure of major-event gridlock and transportation resilience, comparing congestion, idle time, safety and the ability of urban road networks to recover from sudden traffic surges.
The findings show that some metropolitan areas are considerably better prepared than others.
Foxborough/Boston earned the strongest overall score at 8.01, while Houston followed at 7.66. Los Angeles scored just 4.76, making it one of the most vulnerable U.S. locations examined.
A Major Crowd Can Reshape Traffic Across an Entire City
Large events do not simply produce congestion immediately outside a stadium.
Traffic can spread outward along highways, neighborhood streets, airport routes, rideshare pickup areas and commuter corridors.
Around some stadiums, congestion starts four to six hours before the event begins.
At comparable major events, trip volumes surrounding venues have increased by more than 50%, while average speeds on important approach roads dropped from 44 mph to 20 mph.
The effect can persist after an event ends as tens of thousands of people attempt to leave simultaneously.
A survey of Atlanta-area event attendees illustrates why these surges happen. More than half expected to drive themselves, compared with 27.8% planning to use rideshare services and just 12.5% intending to use public transportation.
When personal vehicles remain the dominant transportation choice, even a road network that functions adequately during normal periods can quickly become overloaded.
Nearly 8 in 10 Drivers Say Major-Event Traffic Is More Stressful
Congestion is not simply measured in miles per hour.
It changes the driving environment.
The study found that 79% of U.S. drivers considered driving during major sporting events more stressful than driving on a typical day.
Concern about safety was nearly as widespread. Seventy-six percent of U.S. respondents viewed large events as creating additional road safety risks.
Wasted fuel was another major concern, with more than three-quarters of drivers worried about fuel consumption while sitting in idling traffic.
Work-related travel was also affected.
| Country | Average Major-Event Travel Delay |
| United States | 27 minutes |
| Canada | 29 minutes |
| Mexico | 41 minutes |
For workers, delivery drivers and businesses, those delays can translate into missed appointments, reduced productivity and higher transportation costs.
For emergency services, they can be considerably more serious. Major-event congestion can increase hospital travel times by approximately 3 minutes and 31 seconds.
Boston and Houston Led the Transportation Rankings
Cities were evaluated on a zero-to-10 scale using congestion, idle time, safety and network resilience.
Traffic immediately surrounding each venue represented 60% of the score, while broader metropolitan traffic conditions represented 40%.
Foxborough/Boston ranked first with an 8.01, making it the only location to cross the eight-point threshold.
Houston followed closely at 7.66.
Mexico City ranked third at 7.29.
Strongest Transportation Scores
| Metro Area | Score |
| Foxborough/Boston | 8.01 |
| Houston | 7.66 |
| Mexico City | 7.29 |
Boston benefited from resilient suburban transportation networks and comparatively low idle periods.
Houston’s performance reflected its ability to manage heavy event traffic around NRG Stadium even though the wider Houston metropolitan area experiences considerable everyday congestion.
The comparison highlights an important distinction: a congested city is not necessarily a city that handles major events poorly.
Transportation planning, venue location, transit alternatives and network recovery all affect how severe temporary gridlock becomes.
Los Angeles Ranked Among the Most Vulnerable U.S. Cities
Los Angeles stood at the opposite end of the U.S. rankings.
SoFi Stadium received a score of 4.76, behind Seattle at 5.39, Atlanta at 5.44, Philadelphia at 5.69 and the New York/New Jersey area at 5.80.
Only Toronto and Vancouver recorded lower scores across the broader North American comparison.
Lower-Ranked Major Event Locations
| Metro Area | Score |
| Toronto | 3.99 |
| Vancouver | 4.46 |
| Los Angeles | 4.76 |
| Seattle | 5.39 |
| Atlanta | 5.44 |
| Philadelphia | 5.69 |
| New York/New Jersey | 5.80 |
| Miami | 6.78 |
Los Angeles’ congestion rate around SoFi Stadium reached 59.8%, creating the conditions for prolonged delays after major events.
The city’s problems also extend to parking.
Official park-and-ride options around Los Angeles could cost from $55 to more than $100, while resale parking near SoFi Stadium reached between $256 and $454 for especially high-demand events.
The result is a transportation environment where driving can be both the slowest and one of the most expensive options.
Gridlock Can Amplify Dangerous Driving Behaviors
The study also examined risky driving patterns in several states.
Massachusetts had the highest distracted-driving rate among the host states analyzed, running 18% above the group average.
Texas stood out for high-speed driving, which occurred at a rate nearly 60% higher than in the other states examined.
California recorded sudden-braking incidents 25% more frequently than other host states.
Missouri, by comparison, showed fewer concerns across the major behavioral indicators.
These patterns matter because traffic congestion can produce unpredictable interactions.
Drivers encountering sudden slowdowns may brake sharply. Others may attempt aggressive lane changes or speed when a congested roadway temporarily clears. Navigation apps and unfamiliar detours can increase distraction.
A transportation network’s safety therefore depends not only on how many vehicles it can accommodate but also on what drivers do when capacity is exceeded.
Rideshare Vehicles Can Add to the Pressure
Rideshare services appear to offer a simple alternative to driving and parking, but major events can overwhelm those networks too.
When as many as 70,000 people leave a stadium at once, rideshare pickup areas can become heavily congested.
Demand can also produce dramatic price increases.
At comparable events, surge pricing has reached 400% within two miles of stadiums and 200% to 250% within five miles.
A typical $35 fare can rise to $120 to $150 during peak periods.
Three particularly intense demand windows have been identified around major stadium events:
- Approximately 75 minutes before the event
- Around halftime
- During the first 40 minutes after the event
Travelers who move farther away from the stadium before requesting a ride can dramatically reduce those costs.
At MetLife Stadium, walking away from the venue cut surge pricing from 3.2 times normal fares to 1.6 times and saved riders around $70.
Transit Capacity Gives Some Cities a Major Advantage
Rail systems allow thousands of people to bypass road congestion entirely.
Philadelphia’s Broad Street Line, for example, can move approximately 15,000 passengers per hour during major events.
Houston used expanded rail, bus, park-and-ride and airport services around NRG Stadium, with the METRORail Red Line running every six to 12 minutes.
Dallas-Fort Worth increased light rail and commuter rail services, while Boston expanded bus and subway capacity.
Those investments illustrate one of the study’s clearest findings: cities with multiple transportation options can distribute crowds more effectively than cities heavily dependent on private vehicles.
The importance of that capacity became evident in Arlington, Texas, where AT&T Stadium depended heavily on charter buses because of limited direct public transportation options.
Gridlock Has Become a Measure of Urban Resilience
The study by Attorney Brian White was developed around an unusually large sporting event, but the transportation issues it identified are not temporary.
NFL games, concerts, festivals, conventions, political events and other large gatherings can generate many of the same traffic pressures.
The numbers show how quickly those pressures can become severe.
Traffic volumes can rise more than 50%. Speeds can fall by more than half. Rideshare prices can increase 400%. Congestion can begin six hours before an event, while emergency travel times can increase even for people who never intended to attend.
The difference between the highest- and lowest-performing cities suggests that gridlock is not simply a matter of population size.
How a city designs roads, builds transit, manages traffic, positions major venues and responds when demand suddenly spikes can determine whether a massive crowd produces manageable delays or citywide disruption.
In an era of increasingly large urban events, traffic resilience is becoming a critical measure of how well American cities function under pressure.


America’s Maternal Mental Health Crisis Is Growing

New Analysis Reveals the States with the Highest Teen DUI Risks

When Major Events Push City Traffic to the Breaking Point

America’s Wildfire Crisis Is Becoming More Costly and Complex

Golf Cart Crashes Are Rising as Carts Move Beyond the Course

What Makes a Deck Worth the Investment?

How to Evaluate a Channel Before You Buy YouTube Channels

74.1 Million Americans Speak a Language Other Than English at Home, New Analysis Finds

Listed Price or Tier Price? Finding the Point Where Waiting Pays Off

How to Use AI for Business Automation: Top Use Cases & Real-World Examples

How Kansas City Veterans Court Helps Veterans Avoid Future Legal Trouble

How to Buy Sports Cards Like an Experienced Collector

Understanding the FCRA and Its Impact on Background Checks

From Municipal Clinics to Private HMOs: How Defendant Categorization Shapes What a Family Can Recover

Aspire Gotek X Review: The Cheapest Way to Find Out What Draw You Actually Like

Why Skilled Recruiters Are in High Demand in 2026


Don Toliver Net Worth: Height, Age, Real Name, Career & More
Don Toliver is an American rapper and singer best known for his RIAA platinum certified songs, No Idea and After...


Finesse2tymes Net Worth: Height, Age, Real Name & Career
Finesse2tymes is an American rapper and recording artist. He is mainly recognized for his thunderous voice and motivational lyrics in...


Sugarhill Ddot Net Worth: Height, Age, Real Name & Career
Sugarhill Ddot is an American hip-hop recording artist best known for his songs, Real Facts and I Wanna Love You....


GloRilla Net Worth: Height, Age, Bio, Real Name & Career
GloRilla is an American rapper and hip-hop recording artist from Memphis. She is best known for her popular singles, “Westside...


Destroy Lonely Net Worth: Height, Age, Real Name & Career
Destroy Lonely is an American rapper best known for his 2022 mixtape, No Stylist. He is currently signed to rapper...
-
Rappers2 years ago
GloRilla Net Worth: Height, Age, Bio, Real Name & Career
-
 News2 years ago
Trash To Treasure: Maximizing Space And Efficiency Through Junk Removal
-

 Businessman3 years ago
7 Proven Lead Generation Strategies To Implement in 2023
-
 Businessman2 years ago
Brandon Fugal Net Worth: How Rich is Skinwalker Ranch Owner?
-

 Rappers3 years ago
BigXthaPlug Net Worth: Height, Age, Real Name & Career
-

 TV Stars2 years ago
Kaleb Cooper Net Worth: How Rich is the TV Star Actually?
-

 Internet Stars3 years ago
Mufti Menk Net Worth: How Rich is the Islamic Speaker Actually?
-

 TV Stars2 years ago
Carla Diab Net Worth: How Rich is the TV Star Actually in 2025?
You must be logged in to post a comment Login